
XDA-Developers ran a piece this month about how Codex’s latest update finally added a real usage indicator, and the writer called it the one fix that mattered most to him. The frustration was simple: a coding agent that quietly burned through tokens with no warning until the rate limit slammed shut. Adding a visible counter solved it for Codex users. The catch is that almost nobody runs only one model anymore. If your stack pulls from Claude for refactors, GPT for chat, and Gemini for long-context work, a usage indicator inside one vendor’s CLI does not help. The best apps for AI usage tracking watch every provider at once, log every call, and tell you what each one costs before the invoice arrives. We tested seven that do this well in 2026.
What to look for in AI usage tracking
Five things matter. First, per-call visibility on tokens in, tokens out, and the USD cost of that exact request. Vendor dashboards report aggregates a day late; useful tracking is per-request and live. Second, multi-provider coverage. Anthropic, OpenAI, Google, Mistral, AWS Bedrock, Azure OpenAI, and at least the major open-weight providers should all log into the same view. Third, hard limits and budgets. Soft alerts are useful, but a real circuit breaker that cuts off a runaway agent before it spends a month’s budget overnight is the feature that pays for itself. Fourth, dashboards, traces, and alerts so the team can find the one prompt that doubled in cost last Tuesday. Fifth, a self-host option for shops that cannot route prompts and completions through a third party.
Quick comparison
| App | Open source? | Self-host? | Free tier | Standout feature |
|---|---|---|---|---|
| Helicone | Yes | Yes | Yes, 100k requests/mo | One-header proxy, drop-in in minutes |
| Langfuse | Yes | Yes | Yes, hosted hobby tier | Span-level traces with USD cost |
| LangSmith | No | No | Yes, capped | Tight LangChain integration |
| LiteLLM | Yes | Yes | Free OSS gateway | Virtual keys and per-team budgets |
| Portkey | Partial | Yes (Enterprise) | Yes, capped | Gateway, observability, guardrails in one |
| OpenLLMetry | Yes | Yes | Free SDK | OpenTelemetry-native, plugs into any APM |
| Arize Phoenix | Yes | Yes | Free | Local dashboard, runs in a notebook |
The 7 best apps for AI usage tracking in 2026
1. Helicone, best for drop-in cost visibility today
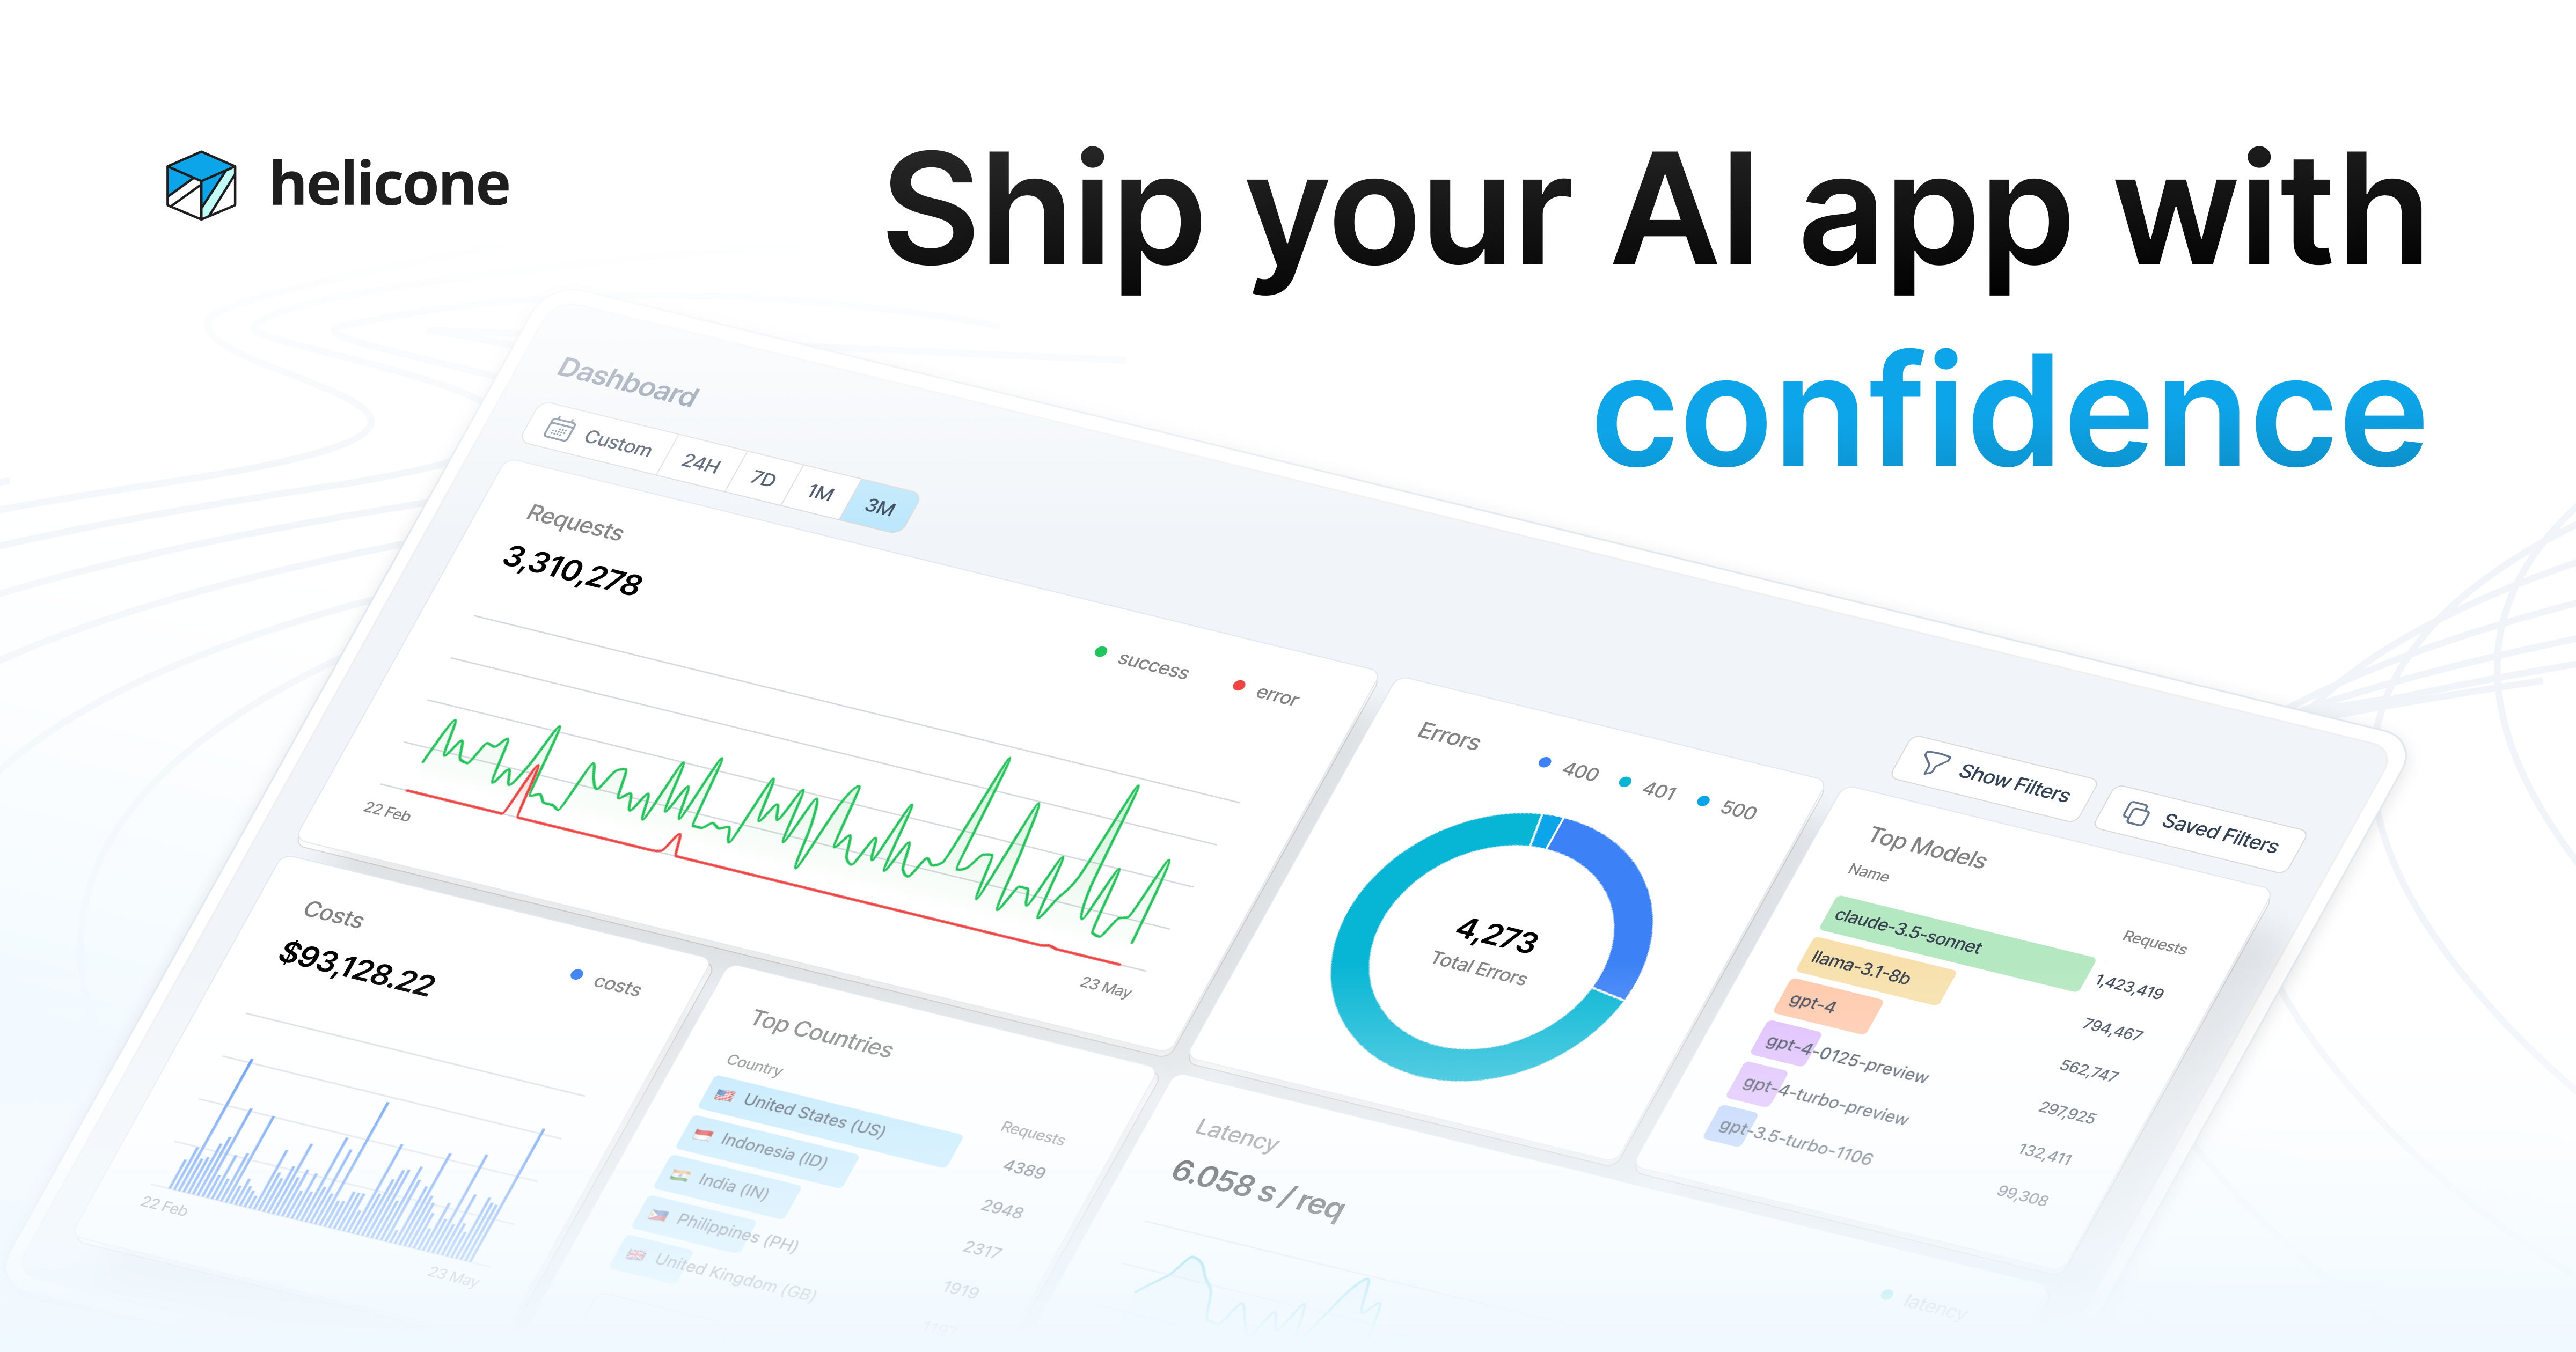
Helicone is the fastest path from “we have no idea what we spend” to a live dashboard. Change one line in your OpenAI or Anthropic client to route through Helicone’s proxy, and every call lands in the dashboard with tokens, latency, USD cost, and the full prompt and completion. The open-source core supports more than 100 models and runs the same way self-hosted as it does on the hosted free tier.
Where it falls short: Routing through a proxy adds a small latency tax, usually 20 to 50 ms. Teams that need sub-100 ms total budgets sometimes prefer the SDK-based approach in OpenLLMetry instead.
Pricing: Free hosted tier covers 100,000 requests per month. Paid plans start around $20 a month for higher volumes and team features. Self-hosted is free under the MIT-licensed core.
Platforms: SaaS web app plus self-hosted Docker for macOS, Windows, and Linux.
Download: helicone.ai
Bottom line: Pick Helicone if you want a working cost dashboard by the end of the day, with no SDK rewrite.
2. Langfuse, best for teams that want to self-host
Langfuse is the open-source observability platform that most serious teams adopt when they outgrow vendor dashboards. It records span-level traces of every LLM call, tool call, and agent step, with built-in tokenizers and USD cost calculation for OpenAI, Anthropic, Gemini, and most major providers. Self-hosting is a documented first-class path, not a footnote.
Where it falls short: Setup is heavier than a proxy. You add an SDK, instrument your calls, and run a Postgres-backed stack if you self-host. Worth it for teams, overkill for a solo script.
Pricing: Free hobby tier on the hosted cloud. Paid plans from around $59 a month for teams. Self-hosted is free under the MIT license, with a paid Enterprise tier for SSO and audit logging.
Platforms: SaaS web app plus self-hosted Docker on macOS, Windows, and Linux.
Download: langfuse.com
Bottom line: Pick Langfuse if your data has to stay on your infrastructure and you want a tracing platform that holds up at scale.
3. LangSmith, best for teams already on LangChain
LangSmith is the hosted observability product from the LangChain team. If your agents are already built on LangChain or LangGraph, the integration is one environment variable, and you get traces, evals, and cost reporting in a single view. Token and USD cost sit next to every run, with per-model breakdowns and a project-level rollup that finance can actually read.
Where it falls short: Closed-source and hosted only. Pricing scales by traces, so chatty agents add up faster than they do on flat-rate alternatives. Less useful if your stack is not LangChain-based.
Pricing: Free tier with capped traces per month. Paid plans from around $39 per seat per month.
Platforms: SaaS web app. SDKs for Python and JavaScript run on macOS, Windows, and Linux.
Download: smith.langchain.com
Bottom line: Pick LangSmith if you already live in LangChain and want cost data sitting next to your evals.
4. LiteLLM, best for gateway and accounting in one binary
LiteLLM is a lightweight proxy that speaks the OpenAI API on the front and translates to a hundred-plus providers on the back. The proxy ships with built-in usage tracking, virtual API keys per user or team, and hard budget limits per key. Hit the cap and the proxy returns a 429; no surprise invoice. It is the closest thing to a one-binary answer for shops that want a gateway and accounting together.
Where it falls short: The dashboard is functional rather than pretty. Teams that want polished traces and prompt-level review usually run LiteLLM as the gateway and pair it with Langfuse or Helicone for the UI.
Pricing: Free under the open-source MIT license. Hosted enterprise plans on request.
Platforms: Self-hosted Docker, Python package, or standalone binary on macOS, Windows, and Linux.
Download: litellm.ai
Bottom line: Pick LiteLLM if you want one process that routes every model and enforces a hard budget at the door.
5. Portkey, best for production teams that want one pane
Portkey is the production-leaning option for teams that need observability, a routing gateway, guardrails, and prompt management in one place. It logs every request, scores prompts against safety filters, and lets ops fall back from one provider to another when a rate limit hits. The dashboard tracks USD cost across providers with the granularity finance teams ask for.
Where it falls short: The core hosted product is paid, with self-host gated to the Enterprise tier. Less attractive for solo developers or open-source-first teams.
Pricing: Free tier with capped requests. Paid plans from around $49 a month for teams. Enterprise pricing on request, with self-host included.
Platforms: SaaS web app with Enterprise self-hosted Docker on macOS, Windows, and Linux.
Download: portkey.ai
Bottom line: Pick Portkey if you want a single pane covering gateway, observability, and guardrails, and the budget supports a paid product.
6. OpenLLMetry, best for shops already on OpenTelemetry
OpenLLMetry is an open-source SDK from Traceloop that emits OpenTelemetry-standard traces for LLM calls, vector store queries, and framework operations across LangChain, LlamaIndex, Haystack, and direct SDK use. The traces land in whatever APM you already run: Datadog, New Relic, Honeycomb, Grafana Tempo, Jaeger, or a self-hosted OTel collector. Token counts and USD cost ride along as span attributes.
Where it falls short: No dashboard of its own; you bring the backend. Teams without an existing observability platform are usually better served by Helicone or Langfuse.
Pricing: Free under the Apache-2.0 license. Traceloop’s hosted product layers on top with usage-based pricing.
Platforms: Python and TypeScript SDKs on macOS, Windows, and Linux.
Download: github.com/traceloop/openllmetry
Bottom line: Pick OpenLLMetry if you already have an APM and want LLM traces in the same place as the rest of your spans.
7. Arize Phoenix, best for solo developers who want a local dashboard
Phoenix is the open-source observability tool from Arize that runs entirely on your machine. Spin it up in a notebook, a container, or as a local process, and traces from your LLM calls and RAG pipelines stream into a dashboard you reach at localhost. It supports OpenInference, the open trace format that overlaps with OpenLLMetry, and includes evaluators for RAG quality, hallucination, and toxicity.
Where it falls short: Designed for development and evaluation rather than long-term production logging. Teams that need persistent storage and team access usually graduate to Arize’s hosted platform or Langfuse.
Pricing: Free under the Elastic-2.0 license. The Arize hosted platform is paid.
Platforms: Python package and Docker image on macOS, Windows, and Linux.
Download: phoenix.arize.com
Bottom line: Pick Phoenix if you build RAG or agent prototypes solo and want a local dashboard with zero accounts.
How to pick the right one
Solo developer testing a side project: Helicone for the proxy, or Phoenix if you want everything local with no third-party hops.
Small team running production agents: Langfuse self-hosted, or Helicone hosted if you can route traffic through a third party. Both give you per-call cost, alerts, and a dashboard non-engineers can read.
Enterprise with compliance constraints: Langfuse self-hosted on your own VPC, paired with LiteLLM as the gateway for hard budgets and virtual keys. Portkey Enterprise if you want one vendor for the whole stack.
OpenTelemetry shop with a working APM: OpenLLMetry. The traces land in Datadog or Grafana next to everything else, and the cost data sits on the spans.
LangChain-first team: LangSmith. The integration is one variable, and the eval tooling matters as much as the cost tracking.
RAG-heavy team in development: Phoenix locally for fast feedback, then Langfuse or LangSmith once you ship.
FAQ
Why not just use the vendor dashboard? Vendor dashboards report aggregates, usually a day late, and only for that vendor. If your stack uses Claude, GPT, and Gemini, you need a single view across all three. The tools above also expose per-request cost while a run is happening, not after the bill arrives.
Will a proxy slow my calls down? A small amount. Helicone, LiteLLM, and Portkey add roughly 20 to 50 ms per call depending on region and network path. For most agent workloads that is invisible. For real-time voice or sub-100 ms loops, SDK-based tracking with OpenLLMetry or Langfuse avoids the extra hop.
Can these tools enforce a hard spending limit? LiteLLM and Portkey can. Both support per-key and per-team budget caps that return an error once a threshold is hit. Helicone and Langfuse send alerts but do not block requests by default. Pair an observability tool with a gateway if you want both visibility and a circuit breaker.
Are open-source AI usage trackers good enough for production? Yes. Langfuse, Helicone, LiteLLM, Phoenix, and OpenLLMetry all run production workloads at well-known companies. The trade-off is operational: you host them, patch them, and scale the database when your trace volume grows.
What about tracking Codex specifically? Codex added a built-in usage indicator in its June 2026 update, which solves the immediate “am I about to be cut off” problem inside the CLI. For team-level cost reporting and cross-provider comparison, you still want one of the tools above. Route OpenAI traffic through Helicone or LiteLLM and you get the same visibility for Codex calls as for everything else.
Do any of these track open-weight models running locally? Yes. Langfuse, Helicone, LiteLLM, OpenLLMetry, and Phoenix all support local providers including Ollama, vLLM, and llama.cpp through OpenAI-compatible endpoints. USD cost defaults to zero for self-hosted models, but token counts, latency, and trace data work the same as for hosted providers.

